

Profiling
In this section, we'll explore how to profile Rspack for identifying bottlenecks. By examining where Rspack spends its time, we can gain insights into how to improve performance. Since different profilers have different strengths. It is good to use more than one.
Build release version with debug info
Performance analysis should be conducted on a release version that includes debug information. This approach ensures accurate performance results while providing sufficient debug information for analysis. Use the following command to profiling using local build rspack.
- Build a release version with debug information:
- Change
@rspack/coreand@rspack/clito uselinkprotocol to link to local build Rspack:
- Reinstall:
Memory profiling
Memory profilers observe allocations at the allocator boundary. The regular Rspack release package uses mimalloc, while @rspack-debug/core uses the system allocator. Use @rspack-debug/core when collecting Heaptrack data or dynamically injecting jemalloc.
In the project you want to profile, override @rspack/core with the same version of @rspack-debug/core as described in Debugging, then reinstall the dependencies. For example, if the project uses @rspack/[email protected] with pnpm:
Heaptrack and jemalloc use different data formats. jeprof cannot read a Heaptrack data file. Do not enable Heaptrack and jemalloc profiling in the same run.
Heaptrack
Heaptrack intercepts system allocator calls and records allocation call stacks. Install it using your Linux distribution's package manager, then run the build under Heaptrack:
Inspect the generated file from the terminal or GUI:
The exact output filename is printed when Heaptrack exits. --record-only prevents Heaptrack from trying to open the GUI automatically, which is useful in WSL, containers, and remote shells.
The system allocator used by @rspack-debug/core allows Heaptrack to capture allocations from the Rspack native binding. The regular release package uses mimalloc and bypasses the system allocator hooks, so its Rust allocation data is incomplete. Depending on the Heaptrack version, the GUI may show Rust v0 symbol names beginning with _R instead of demangled names; this affects display only, not the recorded stacks. For a demangled text report, install rustfilt and pipe the output through it:
jemalloc profiling
On Linux, a build that uses the system allocator can be redirected to a profiling-enabled shared jemalloc with LD_PRELOAD. Install jemalloc, jeprof, and Graphviz using your distribution's packages. On Debian or Ubuntu, the shared library is provided by libjemalloc2; the development package commonly provides the profiling tools.
For example, on Debian or Ubuntu:
Locate the installed library and collect profiles:
The important options are:
prof:trueenables profiling.prof_active:truestarts sampling immediately.prof_final:truewrites a final dump when the process exits.lg_prof_sample:19samples approximately every 512 KiB of allocations.lg_prof_interval:26writes a dump after approximately every 64 MiB of allocation activity.prof_prefixcontrols where profile files are written.
Find the native Rspack binding loaded by the project:
Generate an SVG for a selected dump and open it in a browser:
For a text report sorted by cumulative memory:
The default inuse_space report describes memory that was live when the dump was written. To investigate allocation traffic, add prof_accum:true to MALLOC_CONF and pass --alloc_space to jeprof. Cumulative allocated bytes are not peak memory.
jemalloc only reports allocations routed through jemalloc. Node.js, V8, native libraries, memory mappings, and profiler metadata can also contribute to process RSS. Compare the profile with /usr/bin/time -v when investigating total or peak process memory.
CPU profiling
Samply
Samply supports performance analysis for both Rust and JavaScript simultaneously. Follow these steps to perform a complete performance analysis:
- Run the following command to start performance analysis:
- After the command execution, the analysis results will automatically open in the Firefox Profiler. The screenshot below is from a Samply profiler.
Node.js currently only supports --perf-prof on Linux platforms. JavaScript profiling in Samply depends on --perf-prof support. If you need to use Samply for JavaScript profiling on other platforms, consider using Docker for profiling, or you can compile Node.js yourself for macOS using node-perf-maps for profiling purposes.
JavaScript profiling
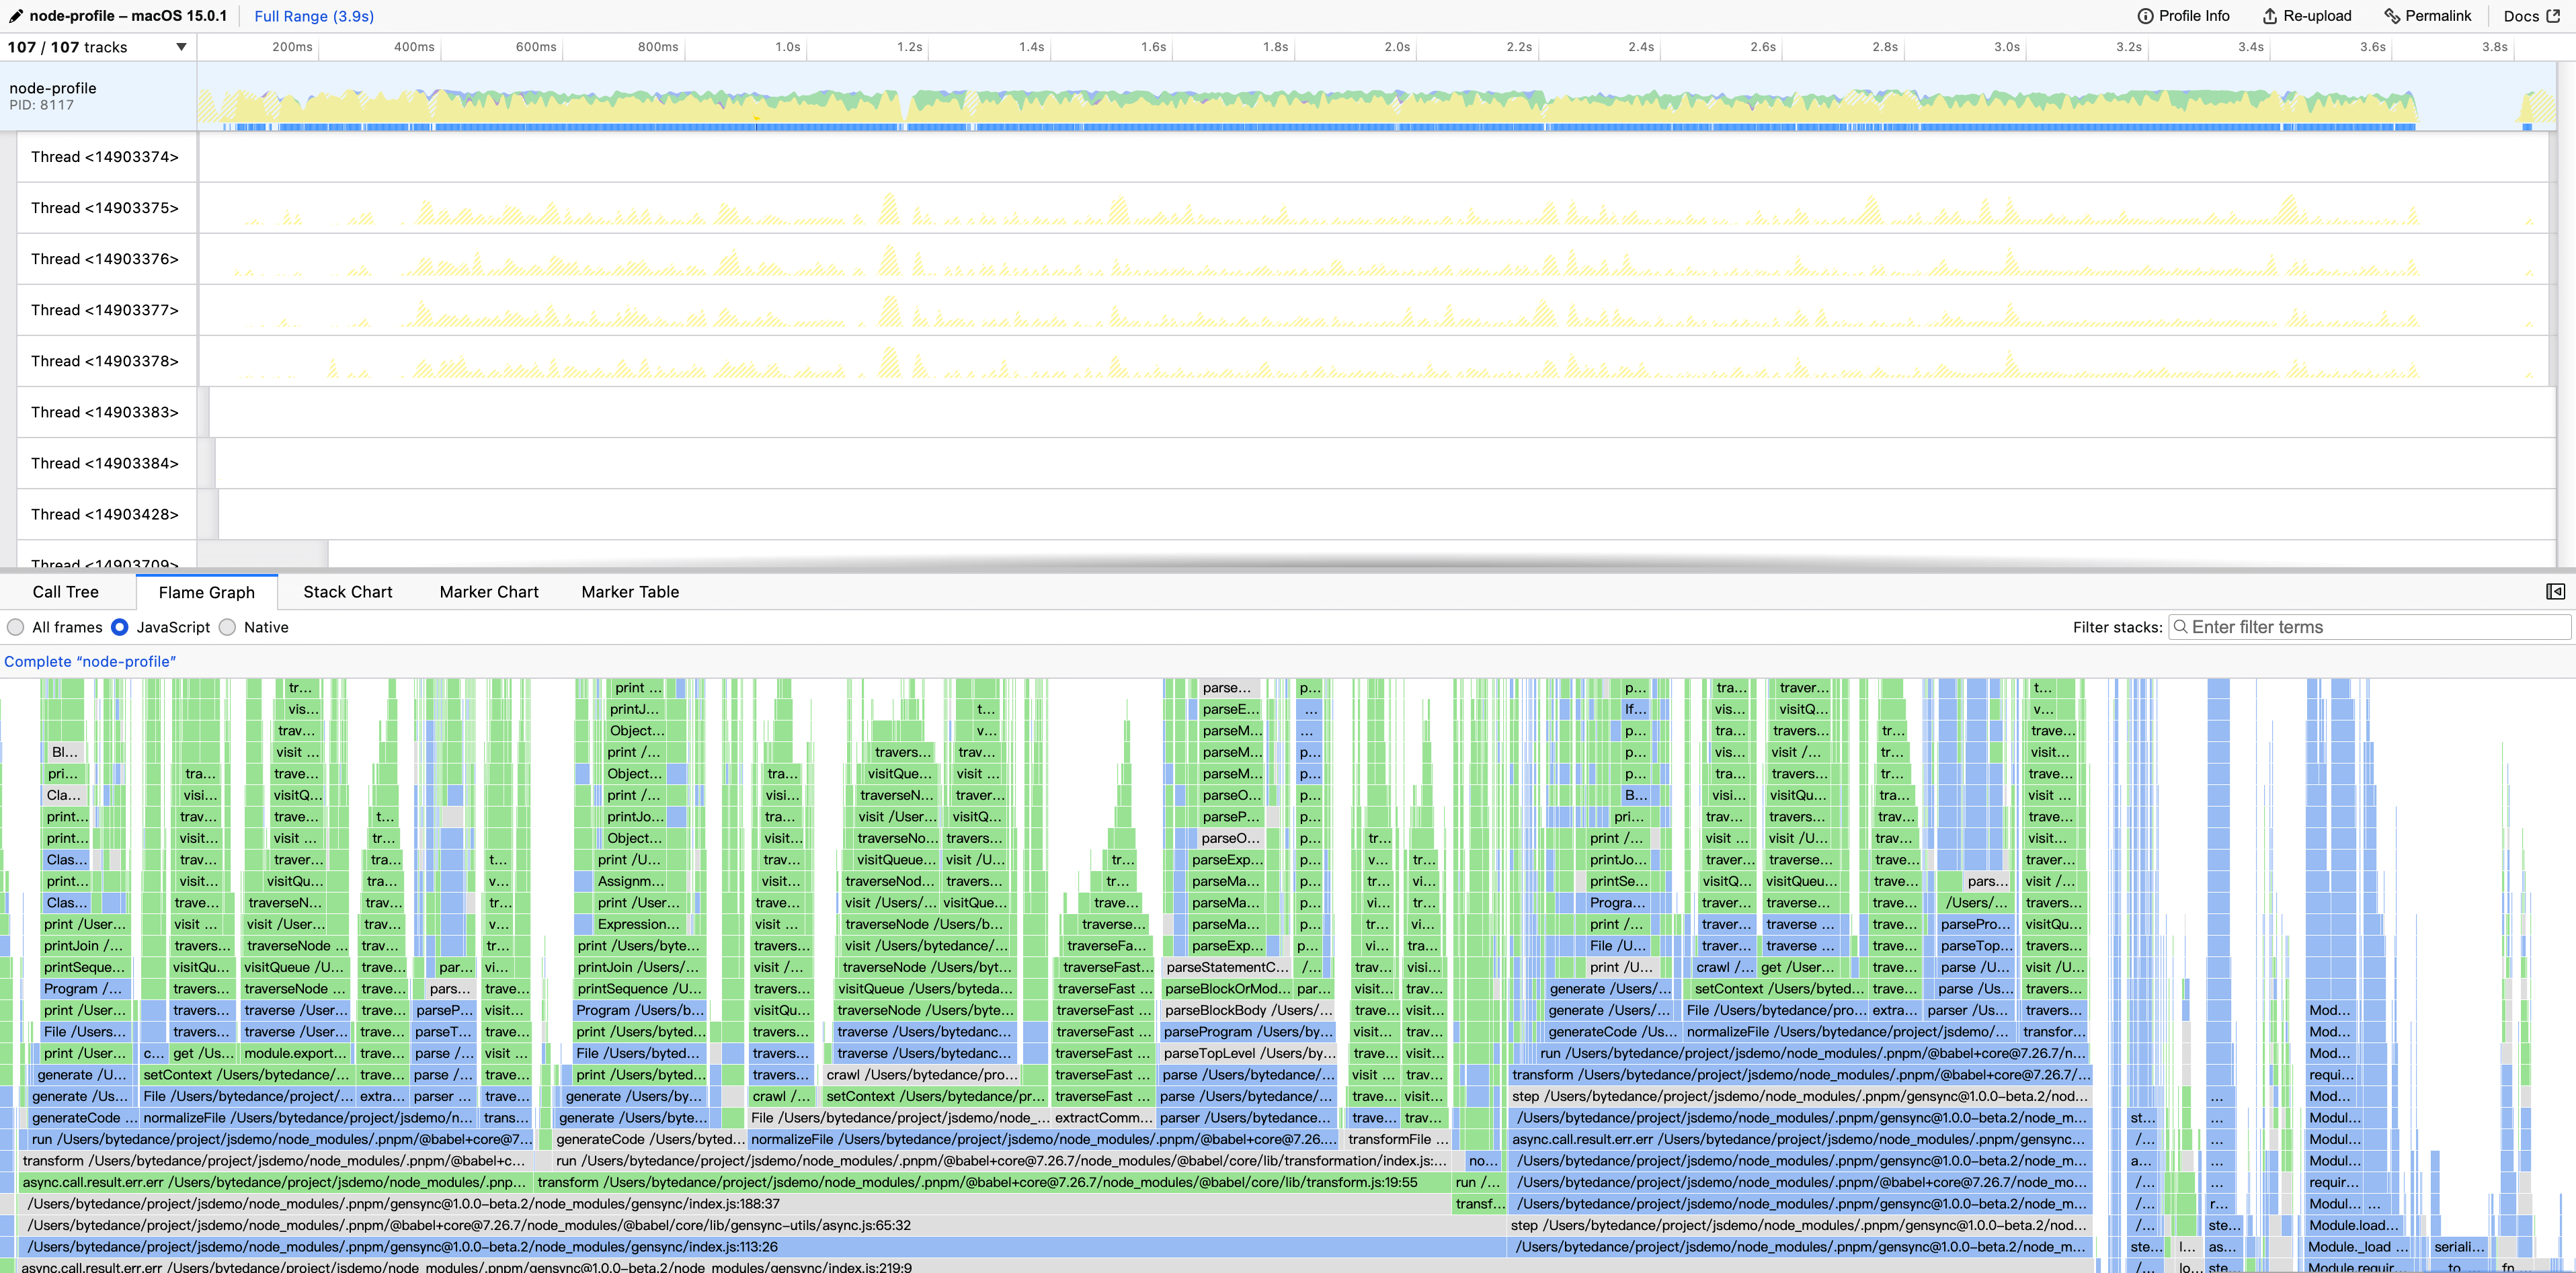
Rspack’s JavaScript typically runs in the Node.js thread. Select the Node.js thread to view the time distribution on the Node.js side.
Rust profiling
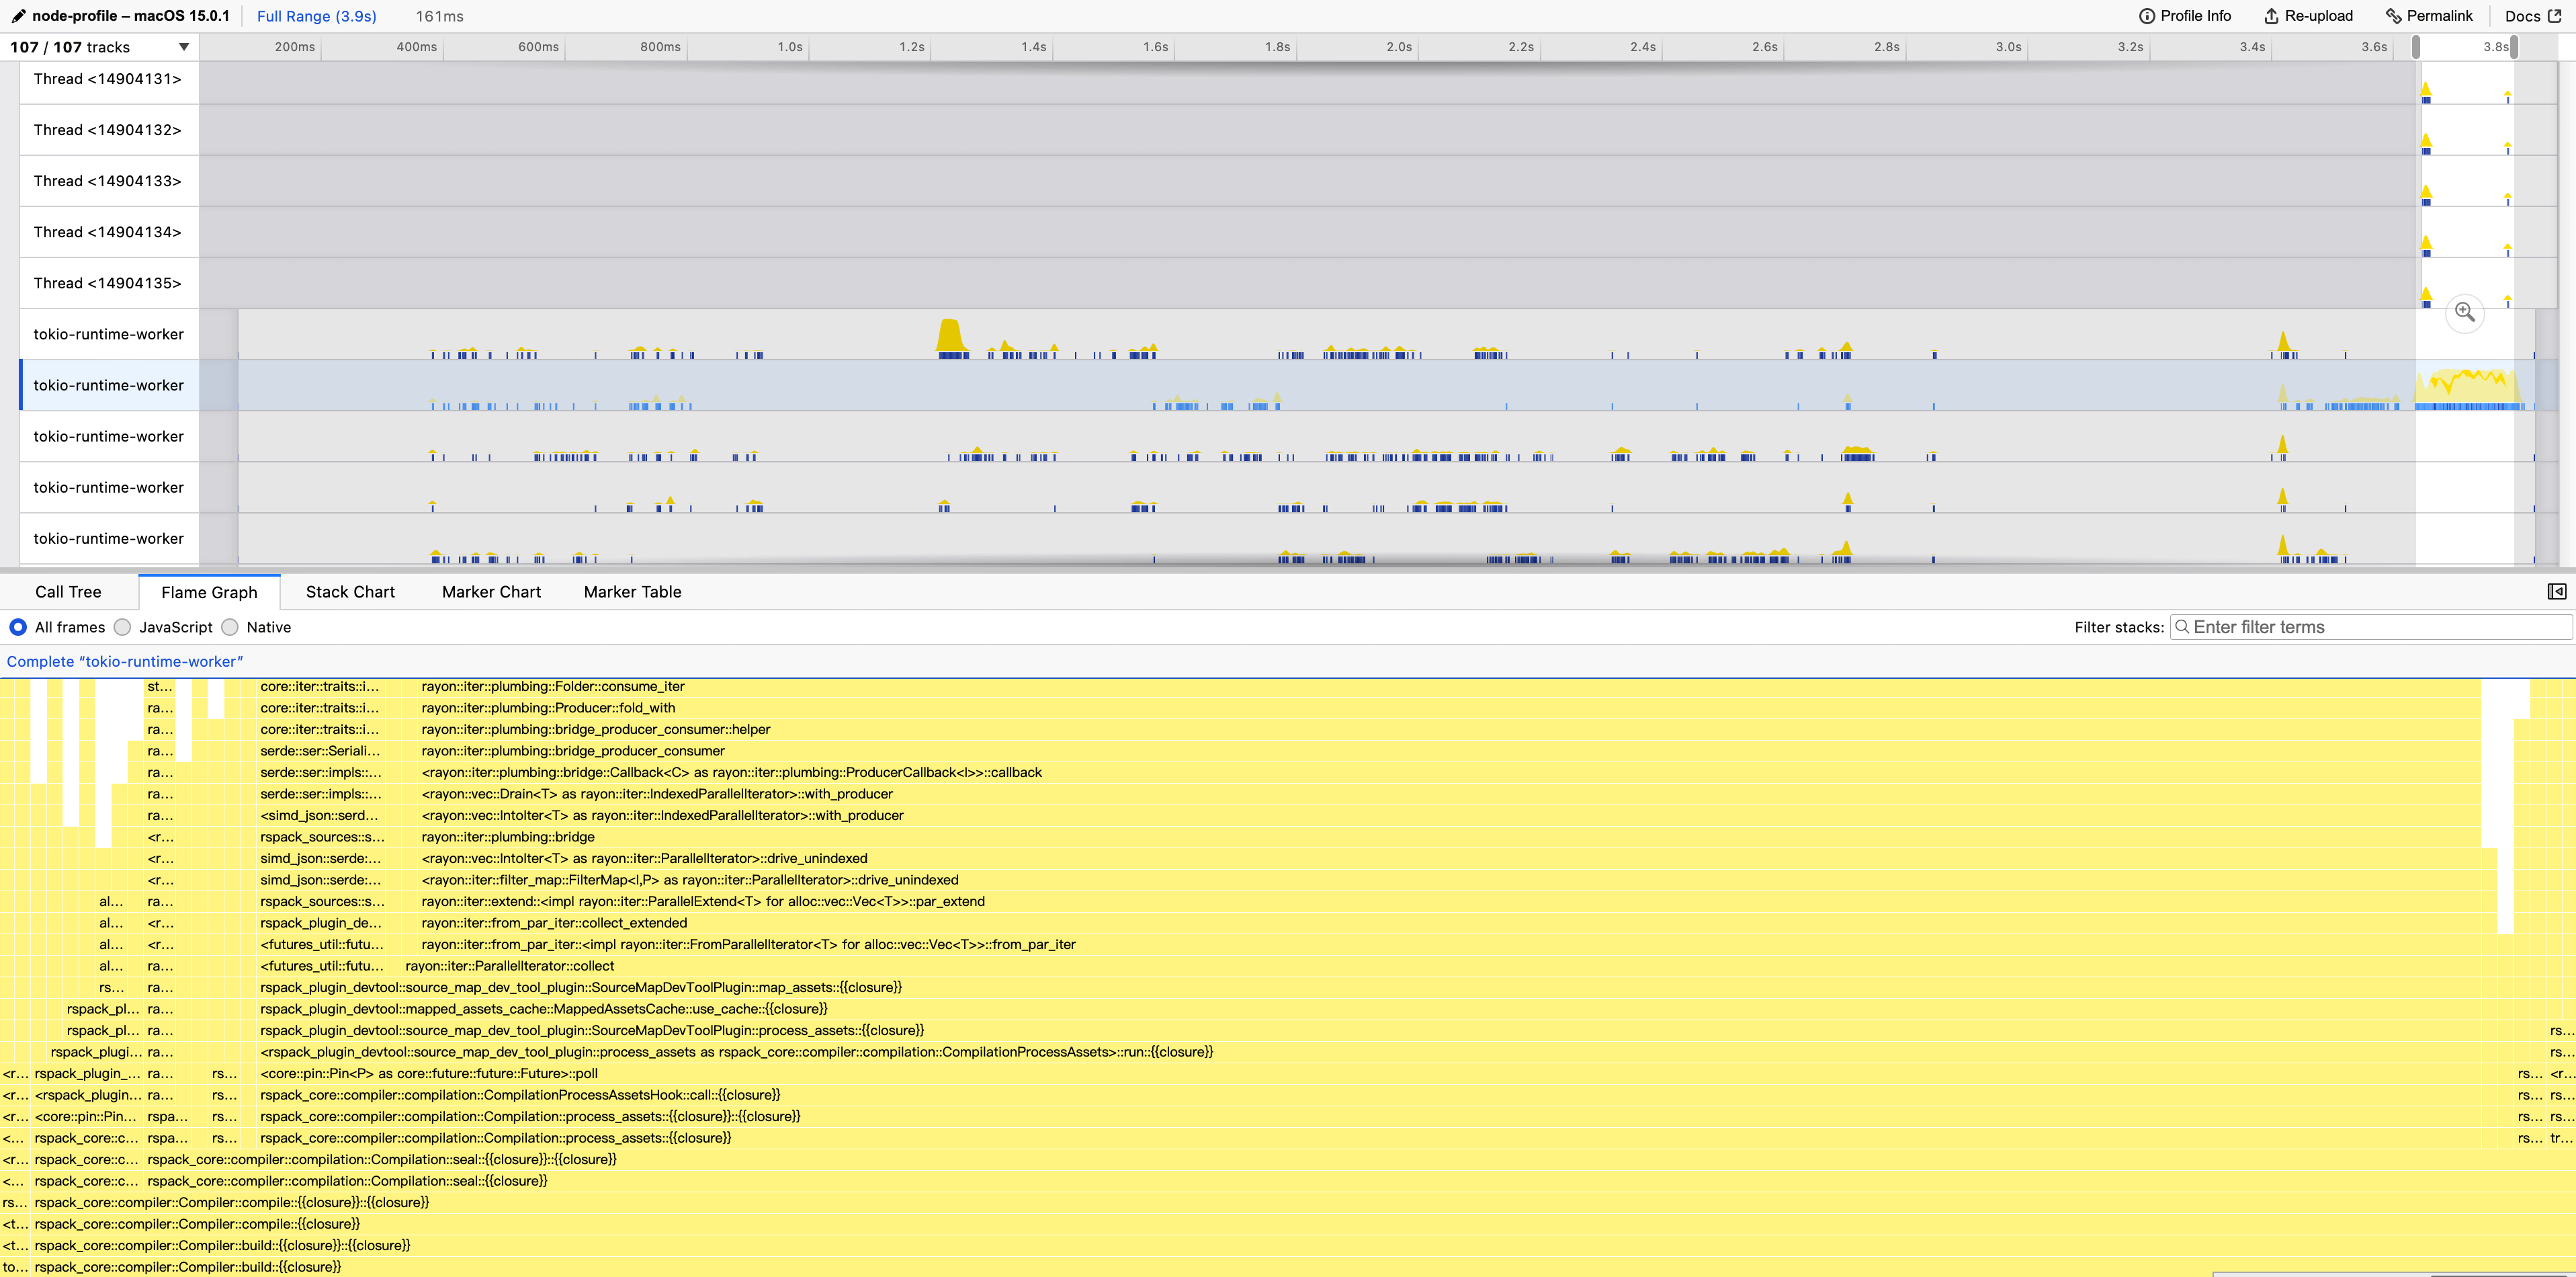
Rspack’s Rust code usually runs in the tokio thread. Select the tokio thread to view the time distribution on the Rust side.
Rsdoctor timeline
If we want to analyze the time cost of loaders and plugins or the compilation behavior of loaders, we can use Rsdoctor to view:
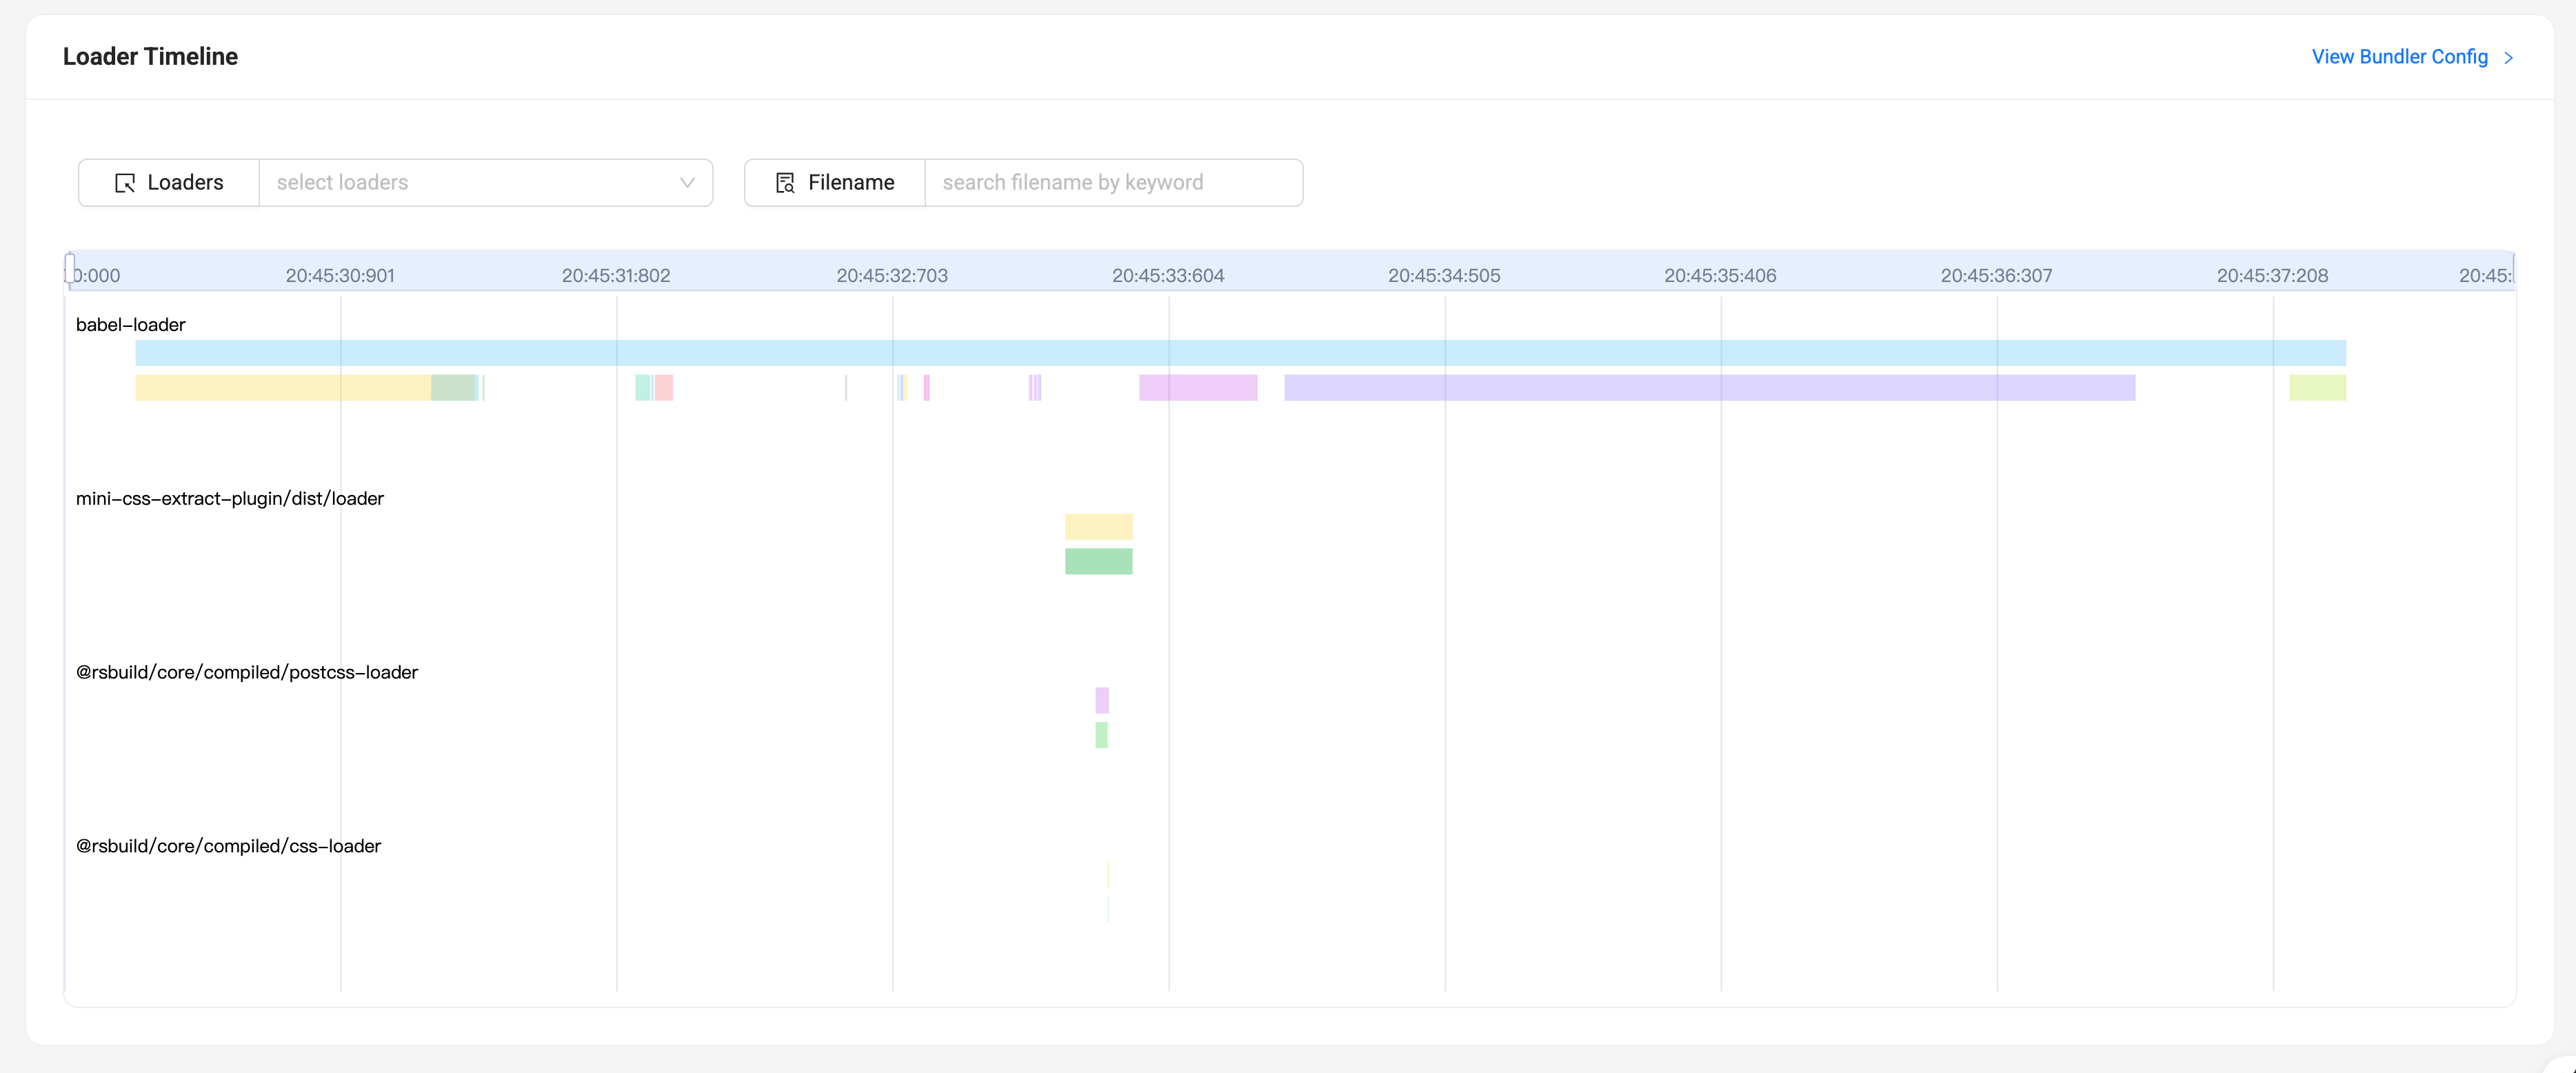
Refer to Rsdoctor Compilation Analysis
Mac Xcode instruments
Xcode instruments can be used to produce a CPU profile if you are on a Mac.
To install Xcode Instruments, simply install the Command Line Tools:
For normal Rust builds, cargo instruments can be used as the glue
for profiling and creating the trace file.
Since Rspack takes quite a while to build, you can use the following procedure without invoking cargo instruments.
It has the same effect.
In workspace root's Cargo.toml, turn on debug symbols and disable symbol stripping in the [profile.release] section
Then build the project
The final binary is located at packages/rspack-cli/bin/rspack once the project is built.
Under the hood, cargo instruments invokes the xcrun command,
which means we can run the following in our own project that uses Rspack.
It produces the following output
We can open the trace file by